

Daily · November 18, 2026
What Do October Housing Starts Mean for Your Next Move?
Last updated:
October’s construction report offers a mixed signal, not proof of a housing rebound. Starts were estimated at a 1.309 million annualized pace, while permits fell. Buyers should compare homes available now, investors should test financing assumptions, and landlords should track actual competing deliveries rather than treat new construction starts as ready-to-rent supply.
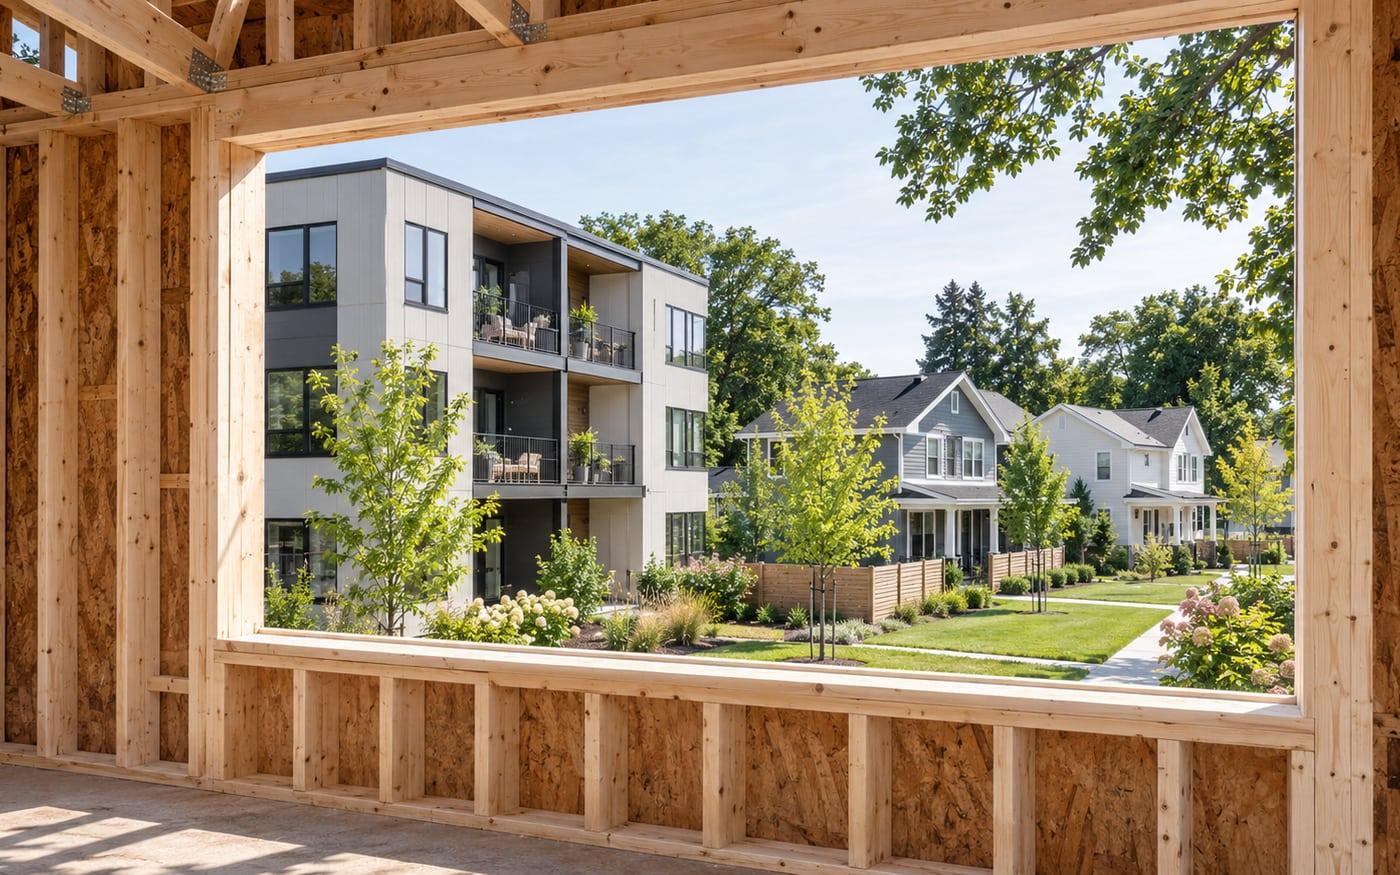
Construction begins well before a home is ready for a buyer or tenant. Illustrative scene, not a documented local development.
Original AI-generated editorial illustration.
What should borrowers take from today’s mortgage reports?
Compare written offers rather than treating a survey average as your available rate. Mortgage News Daily’s completed November 17 observations were 7.48% for a 30-year fixed mortgage and 7.02% for a 15-year. MBA’s November 18 release covers the week ending November 13, a different observation window, and reports a 7.35% conforming 30-year contract rate.
MBA reported a 2.3% seasonally adjusted weekly decline in applications. Its conforming rate included 0.79 points for 80% loan-to-value loans. Freddie Mac’s November 12 weekly averages remain 7.11% for 30 years and 6.45% for 15 years. Different samples and dates explain why these figures need not agree.
For financing context, Treasury’s November 17 closing par yields were 5.10% for 10 years, 5.50% for 20 years and 5.46% for 30 years. Those are government bond yields, not mortgage offers. Compare APR, points, lender credits, cash to close and lock terms for the same loan scenario.
Lending conclusion: a small survey move does not replace a loan-specific comparison. Choose a payment and cash requirement you can carry, rather than depending on a future refinance.
Does the October construction report mean more homes to buy?
Not immediately. Housing starts measure construction beginning, not finished homes available for purchase. Census and HUD’s November 18 report estimates October starts at a seasonally adjusted annual rate of 1.309 million. The reported monthly gain has substantial sampling uncertainty, so it does not establish a clear increase in underlying construction activity.
The estimated 9.9% monthly change has a 90% confidence interval of plus or minus 16.8 percentage points, which includes zero. September was revised to 1.191 million. An annualized rate is a pace calculation, not the number of homes started during October.
October permits ran at a 1.295 million annualized pace. Separately, NAR’s November 12 release puts October existing-home sales at a 3.75 million annualized pace. Neither national series tells you how much negotiating room exists on a particular property.
Residential conclusion: compare actual listings, inspection findings and total ownership costs. Ask builders about documented completion dates and the full price of incentives instead of assuming more starts will quickly lower neighborhood prices.
How should investors use these numbers in an acquisition?
Use the reports as context for a property-specific cash-flow review, not a reason to increase an offer automatically. Treasury’s latest closing yields describe financing conditions, while the construction release describes residential supply. Neither supplies a commercial capitalization rate, a lender commitment or evidence that a particular building will meet its projected income.
Run the purchase with current lender terms, realistic vacancy, insurance quotes, taxes and known repairs. Test whether operating income supports debt service without assuming a cheaper refinance. A residential construction headline is not a measurement of office, retail or industrial demand.
BLS’s November 13 release shows October final-demand producer prices rose 0.3% seasonally adjusted. That broad inflation reading is not a contractor’s bid or a building-specific cost forecast. Obtain actual estimates before changing a renovation budget.
Commercial conclusion: keep the underwriting anchored to leases, operating records and executable financing. National releases can inform the questions you ask, but they cannot answer the property-level diligence for you.
What should landlords watch before changing rents?
Watch delivered competing units and leasing results near the property rather than new starts alone. A project breaking ground may be far from occupancy. Today’s construction release is useful pipeline context, but it does not show local concessions, tenant retention or the rent a particular unit can achieve this month.
Review comparable available units, achieved rents where documented, days vacant and renewal outcomes. Keep construction-stage projects separate from properties already offering tours. A national annualized construction estimate cannot be converted into a neighborhood vacancy rate.
When planning work between tenants, use current vendor quotes and actual scheduling constraints. The broad producer-price release does not establish what your painter, insurer or maintenance contractor will charge.
Property-management conclusion: respond to observed leasing competition and the condition of your units. Avoid building a rent increase or concession policy around a national headline that measures a different stage of the housing pipeline.
What else should readers know?
Today’s reports measure different things: construction activity, mortgage applications and borrowing costs. Keeping their dates and definitions separate makes the numbers useful without turning them into promises. The answers below explain what the new construction estimate can tell you, what it cannot, and why your own financing still needs a written quote.
Were 1.309 million homes started during October?
No. The 1.309 million figure is a seasonally adjusted annual rate, which expresses October’s estimated construction pace on an annualized basis. It is not a count of homes started during that month, and it is not a forecast of how many homes will be completed over the next year.
Does the reported monthly gain prove construction increased?
No. Census reports an estimated 9.9% monthly gain with a 90% confidence interval of plus or minus 16.8 percentage points. Because that interval includes zero, the release does not establish a statistically significant monthly increase. Estimates can also change when subsequent releases revise the underlying data.
Why do the mortgage surveys show different rates?
Mortgage surveys use different samples, methods and observation windows. Daily MND readings, weekly Freddie Mac averages and MBA contract rates should therefore retain their own dates and definitions. None is an individual loan offer; a borrower’s actual pricing depends on the loan scenario, fees, credit profile and lender.
Sources: Census and HUD construction release (October 2026; released November 18, checked November 18); Mortgage News Daily daily surveys (completed November 17 observation; checked November 18); MND 15-year series (November 17 observation; checked November 18); MBA weekly applications (week ending November 13, released November 18); Freddie Mac PMMS (November 12 release; checked November 18); Treasury daily par yields (November 17 closing observations; checked November 18); NAR existing-home sales (October, released November 12; checked November 18); BLS Producer Price Index (October, released November 13; checked November 18).