

Daily · November 16, 2026
What Do Credit and Vacancy Show?
Last updated:
Mortgage pricing, credit approval and vacancy are different signals. For November 16, this brief uses Freddie Mac’s November 12 weekly mortgage survey, the Federal Reserve’s November 2 lending survey and Census’s October 28 vacancy release. Together they support cautious financing and leasing assumptions, not a claim that every property market is moving together.
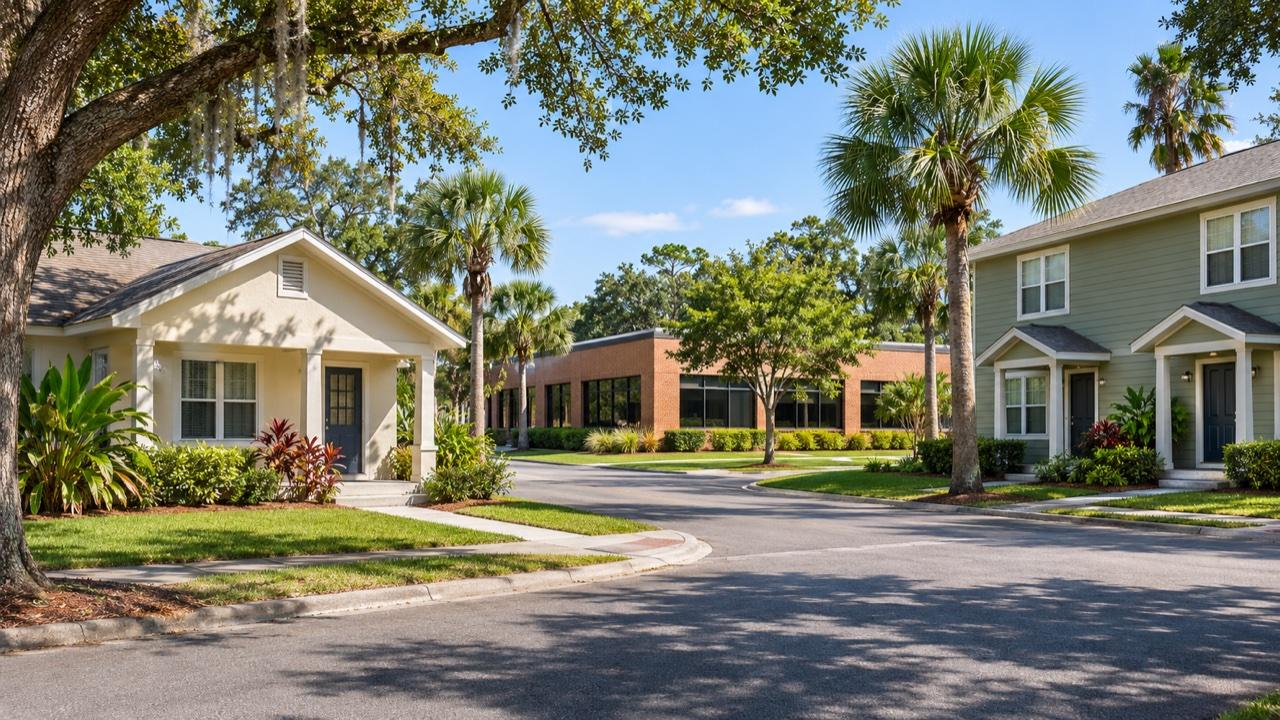
Different property types share financing conditions, but national credit and vacancy statistics do not establish a local property’s performance.
AI-generated editorial illustration.
Does a lower weekly mortgage average mean easier approval?
No. Freddie Mac’s November 12, 2026 PMMS put the weekly 30-year fixed mortgage average at 7.11%, below 7.18% the prior week. That measures pricing in its survey, not a promise of loan approval. The Federal Reserve’s November 2 survey separately described banks’ standards and demand during the preceding quarter.
Editorial interpretation: compare an actual lender’s written terms with the relevant survey period rather than assuming a headline average applies to your application. A lower payment estimate does not establish eligibility. Income documentation, the property and the chosen loan product still need individual assessment. This publication does not issue approvals or rate locks.
Conclusion: the weekly average improved, but pricing and approval remain separate questions. The November 12 figure is a dated weekly observation, not a newly observed November 16 daily rate.
What does the vacancy report say about homes for sale?
The Census Bureau’s October 28, 2026 Housing Vacancies and Homeownership release estimated third-quarter homeowner vacancy at 1.2%, virtually unchanged from the prior quarter and year. This national measure concerns vacant units available for sale within its defined owner inventory; it is not a count of every active listing or a local price forecast.
Editorial interpretation: sellers should not translate a national vacancy estimate into an assumed number of competing homes on their street. Buyers should distinguish the availability of a suitable property from the availability of financing. Comparing current local listings, condition and carrying costs is a separate exercise from reading this national release.
Conclusion: the national homeowner vacancy estimate was stable in the published comparison. It does not establish that a particular Florida home will sell quickly or at its asking price.
How should commercial borrowers read the bank survey?
The Federal Reserve’s October 2026 Senior Loan Officer Opinion Survey, released November 2, reported tighter standards on net for construction and land development, nonfarm nonresidential and multifamily loans. It also reported weaker demand across those categories. These are bank survey responses about recent changes, not a universal refusal to lend or a published property valuation.
Editorial interpretation: a sponsor preparing a refinance should test whether the project can satisfy the actual lender’s underwriting rather than relying on a residential mortgage average. Separate the debt maturity, current operating income and proposed business plan. A financing conversation is stronger when the borrower can distinguish existing performance from hoped-for improvements.
Conclusion: the survey supports careful financing preparation. It does not provide a commercial interest-rate quote, loan-to-value limit or capitalization rate for an individual deal.
Does national rental vacancy set a building’s rent?
No. Census’s October 28 release estimated third-quarter 2026 rental vacancy at 7.6%, compared with 7.1% a year earlier and 7.3% in the preceding quarter. Those national estimates describe a broader rental market. They do not measure a particular building’s physical occupancy, unpaid rent, renewal retention or achievable lease price.
Editorial interpretation: managers can treat the release as a reason to scrutinize their own leasing funnel, not as a rent instruction. Track inquiries, qualified applications, turnover time and actual signed leases. Distinguish an empty unit from an occupied unit with delinquent payments; the operational response and cash-flow consequences are different.
Conclusion: the published rental vacancy comparison points to more national availability. A property-level decision still needs current local competition and the building’s own operating records.
What else should readers know?
These answers separate published national measurements from decisions about an individual loan or building. Each source has its own reporting period and population. A survey average is useful background, but it cannot establish approval, a property’s value, a building’s occupancy or a household’s affordable payment without additional evidence.
Is the 7.11% mortgage figure a November 16 quote?
No. It is Freddie Mac’s weekly 30-year fixed mortgage average published November 12, 2026, not a personal quote or a new November 16 observation. An applicant’s rate and costs depend on actual lender terms. A weekly survey and a daily market measure should not be presented as interchangeable.
Does the Fed survey mean every bank tightened every loan?
No. The Federal Reserve reports survey results on net, rather than a rule followed by every institution. The November 2 release describes different categories separately. Its commercial real estate findings do not mean that an individual lender must reject a qualified borrower or impose identical terms on every property.
Can national vacancy predict one property’s performance?
No. National vacancy estimates describe a survey population and reporting period, not a specific building’s future income. Local competing supply, property condition, lease terms and management execution can differ substantially. A property-level assessment requires its own evidence rather than applying a national percentage as a guaranteed operating outcome.
Sources: Freddie Mac PMMS (November 12, 2026 weekly release; checked November 16, 2026); Federal Reserve October 2026 SLOOS (released November 2, 2026; checked November 16, 2026); Census Housing Vacancies and Homeownership (third quarter 2026, released October 28; checked November 16, 2026).